This is a CFO level tool to evaluate future capital expenditures and can also be used to evaluate stock picks. Remember this is not financial advice, so use at your own risk. Click here to read full disclaimer.
This can be a powerful tool to evaluate projects and stocks, but for this blog, we will use it to evaluate stock picks. This blog will be an effort of breaking down on how to fill this form out as simply as possible.
What this workbook does is project cash flows over the future and places a Net Present Value(NPV) on the numbers inputted. The discount rates show how undervalued the stock is according to the information in the workbook. Keep in mind everything is being forecasted. So we have 2 tables. 1 table forecasts sales based on the recent year over year growth. The other table forecasts sales growth based on the analysts estimates.
Home Page
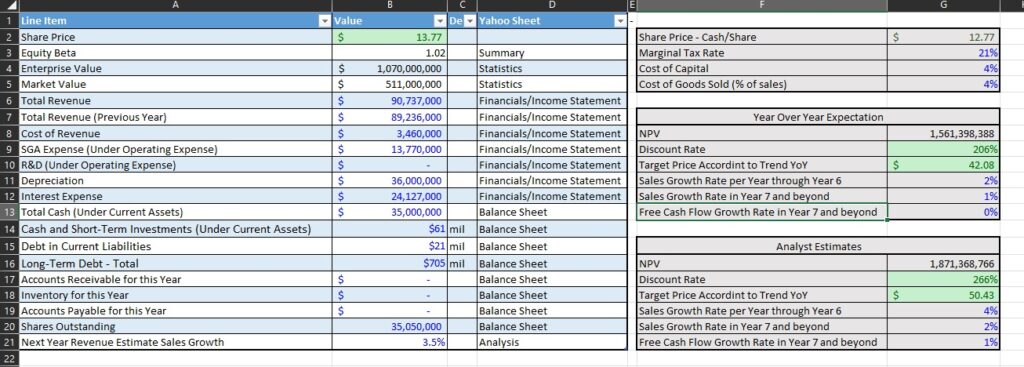
When you open the document, there are 2 tabs located on the bottom. There are some hidden pages that work out the calculations in the background but they are not neccessary to go over. We have the “NPV table” tab and the “Cost of Capital” tab. The NPV Table uses the companies public financial records to find a value. The Cost of Capital takes in factors such as the interest rates.
For this worksheet, you will need to pick a stock, and gain access to the companies financials. Such as income statement and balance sheet. Most of this information can be found on many public domains such as Yahoo finance. On the worksheet I indicate which yahoo page can be used to find the information.
So let’s begin to go down this worksheet.
Everything that is greyed out doesn’t need an entry. The 3 tables on the right side of the page do not need any entries made.